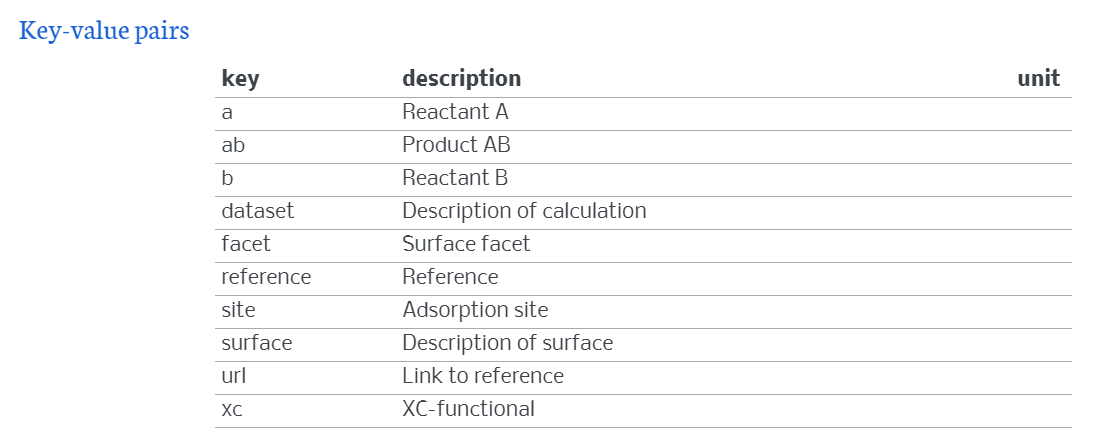
表面吸附
数据库:
CatApp data (Calculated reaction and activation energies for elementary coupling reactions occurring on metal surfaces)
CatApp: A Web Application for Surface Chemistry and Heterogeneous Catalysis
Filetype: csv
The csv-file has been converted to an ASE db-file using this script:
```python import csv import ase.db from ase import Atoms
reader = csv.reader(open('catappdata.csv')) next(reader) # skip header with ase.db.connect('catapp.db', append=False) as con: for er, ea, surface, ab, a, b, ref, url, dataset in reader: if surface.startswith('HH- '): surf = surface[4:] else: surf = surface keys = {} words = surf.split() if len(words) == 2: surf, keys['site'] = words else: surf, = words symbols, facet = surf.split('(') facet = '(' + facet symbols = symbols.replace('-', '') atoms = Atoms(symbols, pbc=(True, True, False)) a, b, ab = (x if x[:2] != 'hf' else x[2:] + '/2' for x in [a, b, ab]) for xc in ['RPBE', 'PW91', 'BEEF']: if xc in dataset: break else: xc = '???' if ea: keys['ea'] = float(ea) con.write(atoms, a=a, b=b, ab=ab, er=float(er), surface=surface, facet=facet, xc=xc, ref=ref, url=url, dataset=dataset, **keys)
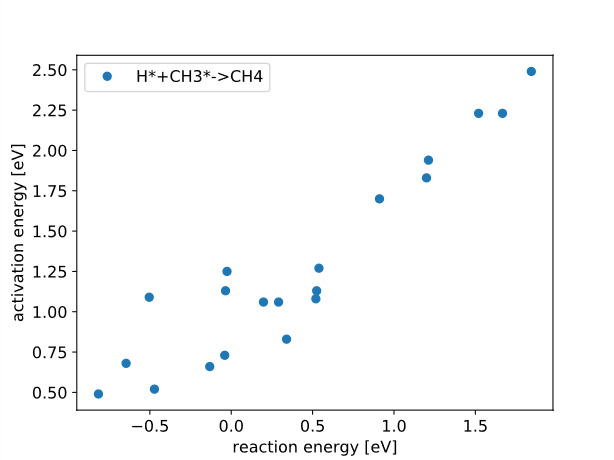
Methane example:
Here we look at the correlation between the activation and reaction energy for this reaction:
$\ce{H*+CH3*->CH4}$
```python
import matplotlib.pyplot as plt
import ase.db
con = ase.db.connect('catapp.db')
x = []
y = []
for row in con.select(a='H*', b='CH3*'):
x.append(row.er)
y.append(row.ea)
plt.plot(x, y, 'o', label='H*+CH3*->CH4')
plt.legend()
plt.xlabel('reaction energy [eV]')
plt.ylabel('activation energy [eV]')
plt.savefig('ch4.svg')
catMAP(see also in Chapter 11):得到描述符与体系动力学之间的关系
d band center theory:
- see in [Fundamental Concepts in Heterogeneous Catalysis]
- https://zhuanlan.zhihu.com/p/26230183
- d-band center是substrate的性质
- https://www.zhihu.com/question/46558379
- The metal d-band hybridizes with the bonding (σ) orbital of the adsorbate to form bonding (d-σ) and antibonding (d-σ) states, as illustrated below. For the metals we are concerned with, the (d-σ) state is full, but the extent of filling of the (d-σ) state depends on the local electronic structure of the metal at the surface, i.e. the surface DOS. An increased filling of the antibonding (d-σ) state corresponds to a destabilization of the metal-adsorbate interaction (and hence weaker binding). As it turns out, there is one experimentally-determinable parameter which correlates highly with the extent of filling of the (d-σ) MO: the location of the d-band center
- https://sites.google.com/site/orrcatalysiswithptbasedcsnps/home/d-band-theory/results---location-of-d-band-center-for-various-bulk-alloys